Reduce sediment production (watershed management)
Off-stream reservoir
Empty flushing
114 Mm³ (original)
N/A
1973
The Welbedacht Dam lost 50 per cent of its storage capacity due to sedimentation during the first five years of operation. Empty flushing has not been effective due to fail in the dam's design, but its off-stream reservoir is deemed more successful. At present, volume is approaching equilibrium at 95 per cent storage loss.

Welbedacht Dam, a 32 m high concrete gravity dam located in the Caledon River, South Africa, which is part of the Orange-Senqu River system, was completed in 1973 with an original storage capacity of 114 Mm3. The reservoir is 43 km long, with a slope of 0.00048. The dam was built to supply water to Bloemfontein City, supplying 35.98 Mm3/yr on average. Since sedimentation has severely reduced its reservoir storage capacity an off-stream storage reservoir, Knellpoort Dam, was constructed to supplement storage.
Although the dam was designed to facilitate empty flushing it is not effective because the invert level of the gates is too high above the river bed and the flushing duration is limited by the downtime allowed at the water treatment plant, which is very short.
The dam houses six radial gates serving as a spillway with an invert of approximately 1395 masl, which is 15 m above the original river bed. The maximum (Full Supply Level (FSL)) and minimum operating levels are 1402.9 masl and 1385.22 masl respectively. The original riverbed elevation at the dam was 1380 masl, which has increased to 1394 masl due to sedimentation.
The catchment area upstream of Welbedacht Dam is 15,285 km2, with mean annual precipitation equaling 700 mm/yr. The Caledon River at Welbedacht Dam produces mean annual flow equaling 1,241 Mm3/yr with an annual coefficient of variation of 0.589. As shown in figure 1, most of the inflow is received from April to June.
The average total sediment load is 15 Mt/yr, consisting of estimated bedload of 1.5 Mt/yr and suspended sediment load equaling 13.5 Mt/yr; equating to a specific sediment yield of 838 t/km2/yr. The sediment is composed of fine material mainly silt and clay. The particle size distribution of the sediment is 5 per cent gravel, 15 per cent sand, 50 per cent silt and 30 per cent clay. The rating curve used to calculate the suspended sediment load is C = 793.32* Q0.664 (where C = sediment concentration in (g/m3) and Q = water discharge (m3/s)).
The original reservoir volume of 114 Mm3 reduced by 50 per cent within the first five years of operation. Sedimentation continued and the current reservoir volume is 5.4 Mm3. The original relationship between the reservoir volume and average annual flow was 0.092, which, based on the Brune curve, originally trapped 85 per cent of the incoming sediment. The current reservoir volume – average annual flow ratio is only 0.004, which means that the sediment trap efficiency is very low (almost zero). The maximum storage loss that occurred in a single year was 12 Mm3, while the average annual storage loss is 2.48 Mm3/yr. This is equivalent to 2.2 per cent storage loss on average per year.
By 1978, only five years after completion of the dam, it was clear that there are problems because nearly 50 per cent of the original Full Supply Capacity (FSC) was lost due to sedimentation. Plans were put in place to deal with the reduced storage capacity by designing the off-stream Knellpoort Dam and Tienfontein pump station to deal with the loss in storage capacity of Welbedacht Reservoir. Based on the bathymetric surveys, by 1978 it was clear that the sluicing/flushing of sediment through the Welbedacht Dam is not as effective as the designers and operators hoped it would be. In figure 2, the longitudinal profiles show the increase of sedimentation. The first five years was a relatively wet period and further downstream on the Orange River one of the large dams was under construction. To protect the construction site against flooding, Welbedacht Dam was operated to store flood water and empty flushing was not implemented. This increased the rate of sedimentation especially during the first 3 years.
The high inflowing sediment load has decreased the reservoir storage capacity to currently only 5 per cent of the original full supply volume as seen in the graph in figure 3. The small storage capacity now makes it difficult to deal with droughts that normally last 3 to 5 years. Near the dam the intake to the potable water treatment plant is affected by the reservoir sedimentation, which due to high suspended sediment concentrations results in higher chemical treatment costs. Further upstream in the reservoir the Tienfontein pump station was constructed during the 1980s to pump to an off-stream storage called the Knellpoort Dam. The pump station is now due to the rise in reservoir bed level, which is much higher than the full supply level of the reservoir.
The experiencing severe problems Bloemfontein to Wepener road bridge which crosses the river about 50 km upstream of the dam, had to be raised by more than 10 m during the past decade due to the reservoir sedimentation causing significantly higher flood levels; even during annual floods the bridge deck was submerged before the raising. Figure 4 and 5 are two images taken during the 2000s of the river at the Dewetsdorp-Wepener bridge. This was before the raising of the bridge. The first photo shows the sediment near the deck and the second photo the regular flooding of the road due to the high silt levels.
The sedimentation problems cannot really get worse than what they are at present, with the reservoir silted up 95 per cent, the water treatment plant at the dam operating as run-of-river abstraction and with the upstream abstraction at Tienfontein pump station having difficulties to deal with the high reservoir bed and silt loads.
The sediment management methods used include watershed management, empty flushing and off-stream reservoir.
Watershed management entailed constructing weirs in upstream river during the 1950’s. These weirs rapidly filled with sediment, causing downstream erosion. Gullies are natural features of the catchment and are not considered the main source of sediment. It is estimated that catchment management activities have been about roughly 10 per cent effective.
Empty flushing was implemented for the first time in 1992, which is about 19 years after project commissioning. Efforts to remove sediment from the reservoir through flushing has not been very effective, partly since the invert elevation of the radial gates used for flushing is about 15 m higher than the original river bed. Drawdown of the water surface elevation occurs at a rate of 8 m/day, and flushing may occur twice a year for a period of one day. The water treatment plant prefers to limit downtime to about 12 hours, which further reduces the effectiveness of drawdown flushing.
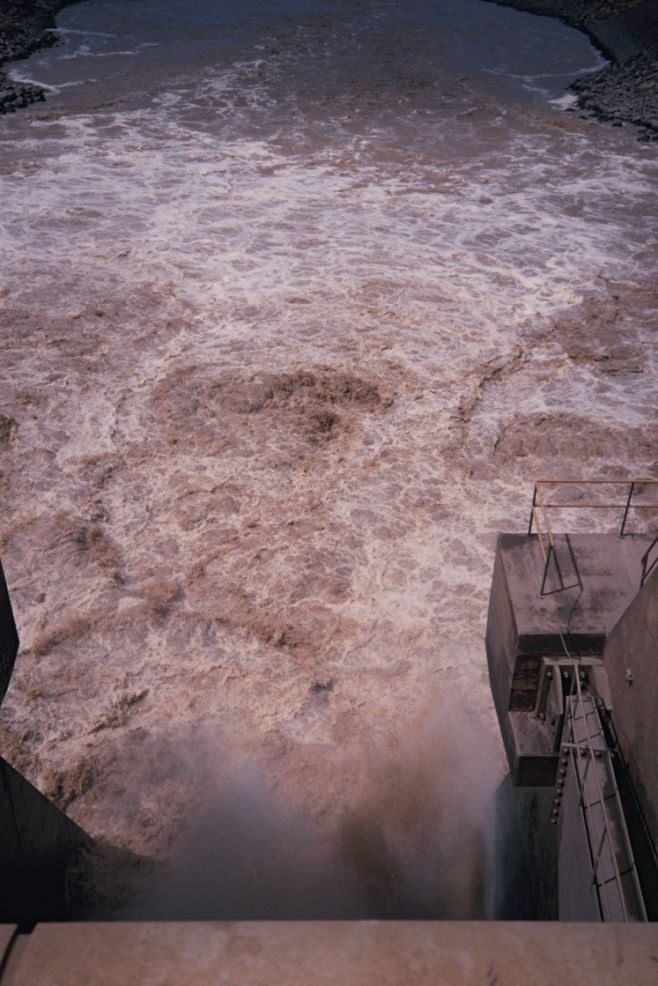
The amount of sediment flushed during a single flushing event in 1992 was about 3 Mm3. The upstream view of the flushing operation in 1992 and the downstream discharge can be seen in figure 6 and 7. The sediment concentration during flushing events ranges from an average of 73,128 mg/l to a maximum of 134,400 mg/l. Empty flushing is deemed to be about 10 per cent effective.
Off-stream reservoir through construction of Knellpoort Dam, which was constructed in 1988 is deemed 70 per cent successful. Its rate of sedimentation is very low and it storage capacity has not reduced significantly since commissioning. However, the problems experienced at the pump station due to high sediment levels in Welbedacht Reservoir presents difficulties.
Recently, without flushing, the reservoir volume is approaching equilibrium at about 95 per cent storage loss. Routing, empty flushing and off-stream storage will be further sediment management strategies to be considered in the future.
The effectiveness of flushing may be improved in the future by reconstructing the dam outlets through lowering them. Furthermore, to improve the efficacy of flushing longer downtime periods at the water treatment plant are required. This may be accomplished by providing additional raw water storage for a minimum of three days at the water treatment plant. Other alternatives include constructing a pipeline from Gariep Dam to Bloemfontein for more water supply and a pipeline from Knellpoort Dam to the Welbedacht Dam water treatment plant.
Although Welbedacht Dam was originally designed to facilitate flushing the invert of the radial gates was too high and the acceptable downtime at the water treatment plant too short to ensure removal of enough sediment through flushing. It may also have been possible to maintain more favorable storage conditions if flushing commenced soon after commissioning of the reservoir, instead of waiting almost 20 years to implement it for the first time.