Reduce sediment production (watershed management)
Empty flushing
Modify operating rule (focus or redistribute sediment)
17 Mm³ (original)
177 MW
1960
Heavy sediment transport is to be expected in a basin with steep slopes and high precipitation levels, that can reach over 6,000 mm annually. Without the implementation of any sediment management strategy, the Angostura reservoir would be lost to sedimentation within 20 years. Sediment management strategies that have been incorporated into the design phase include an operational rule to minimise sedimentation in the reservoir, empty flushing and watershed management planning.

The Angostura hydropower project is a run-of-river project with an installed capacity of 177 MW located in the middle reach of the Reventazón River, forming part of a cascade scheme owned and operated by the Costa Rican Electricity Institute (ICE). The 161 MW Cachí hydropower plant is located 18 km upstream, whose reservoir also provides water for the privately-operated 50 MW La Joya hydropower plant; the 134 MW Río Macho project further upstream; and the 305.5 MW Reventazón plant located downstream, commissioned in 2016 (see figure 1). Together, the plants have a total installed capacity of 522 MW, which represents almost 40 per cent of the country’s entire installed hydropower capacity. Sediment management plans are crucial for maintaining volume and for generating electricity reliably to supply the national grid.
The USD 350 million project includes a 38 m concrete gravity dam, which creates a reservoir of 2 km in length with a total capacity of 17 Mm3 and a live capacity of 11 Mm3. The riverbed slope at the entrance of the reservoir is 0.05 m/m. The run-of-river project will be operated to match the daily peak demand, where the maximum and minimum operating levels are 577 and 570 masl respectively. The design discharge is 160 m3/s.
The total area tributary to the dam is 1,463 km2, with a maximum elevation in the watershed of 3,800 masl; an average precipitation level of 3,500 mm; and an average temperature of 22 ⁰C. The Reventazón River is characterised by a high suspended sediment load: in particular, during high precipitation events, the river can convey 80 per cent of the annual suspended sediment load. In wet years, the sediment load can reach up to five times higher than the annual average. At Angostura, the expected suspended sediment load is 3 million tons a year, and the bed load is 0.3 million tons. The material is mostly fine sand and silt. Bed load sediments are expected to be trapped behind the dam.
Sedimentation studies and a sediment management plan were included in the design phase, taking into consideration the sediment management practices of the Cachí reservoir upstream. Although commissioned in 1966, Cachí has been implementing empty flushing since 1973. Almost every year in October the empty flushing takes place over a few hours, discharging around 20 per cent of the total annual suspended sediment load that reaches Angostura.
The initial calculations showed that Angostura would be lost to sedimentation in 20 years in the absence of any sediment management strategy being implemented.
The Angostura reservoir can be divided into two areas: one upstream of the island, which is shallow and wide; the other deeper between the island and the dam. This geographic configuration adds complexity to the sediment management strategies at Angostura, compared to Cachí. The island influences the sedimentation distribution, and the surface turbidity is in fact the highest on the west side of the island.
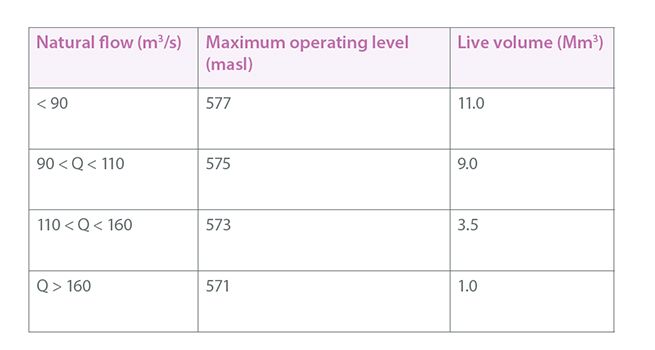
During the wet season, initial studies proposed operating the reservoir at minimum levels to minimise sediment deposition in the live volume. As the table in figure 2 shows, this means that for flows of over 160 m3/s, the maximum level must be 571 masl so sediments are not deposited in the delta. With the following operating rule in place, it is estimated that 50 per cent of sediments will pass through the dam.
Sedimentation studies and a sediment management plan were included in the design phase, taking into consideration the sediment management practices of the Cachí reservoir upstream."
Empty flushing is carried out on average twice a year, with one event synchronised with the October empty flushing at Cachí. The two bottom outlets of 4 m wide by 5.5 m height at 552 masl, shown in figure 3, are used to flush the reservoir and protect the intake, which is located 13 m above. The empty flushing lasts around 23 hours.
Figure 4 shows an example of the two distinct phases of empty flushing in October 2002: during the first, there is a time difference of around four to six hours between flow and concentration, while the second corresponds to the arrival of the flow due to flushing at Cachí. Concentrations can reach up to 150,000 ppm and, during the decline phase of around two days, concentrations still oscillate between 20,000 and 10,000 ppm.
Empty flushing at Angostura follows a five-stage procedure that is summarised in the the table shown in figure 5. The initial and the final level is 577 masl, the maximum operating level. During the first stage, the level drops down to the minimum operating level, so the power plant can still operate. During stages two and three, the power plant stops operating because the level drops below the minimum operating level, to 562 masl. In stage 4, the level is maintained, and in the last stage, the reservoir is refilled.
There are some years however when flushing only takes place at Angostura, and not at the Cachí reservoir. For example in 2012 Angostura performed one empty flushing procedure with a maximum discharge of 271 m3/s and a maximum concentration of about 62,000 ppm. The total load that passed through the bottom outlets was estimated at 517,300 tons. Bathymetric surveys were carried out before and after the flushing operations to calculate the volume recovered. Before flushing in October 2012, the total volume surveyed was 10.5 Mm3 and after flushing, the total volume reached 11.3 Mm3. Although it recovered 0.8 Mm3, the volume loss from 2011 to 2012 was about 1.2 Mm3.
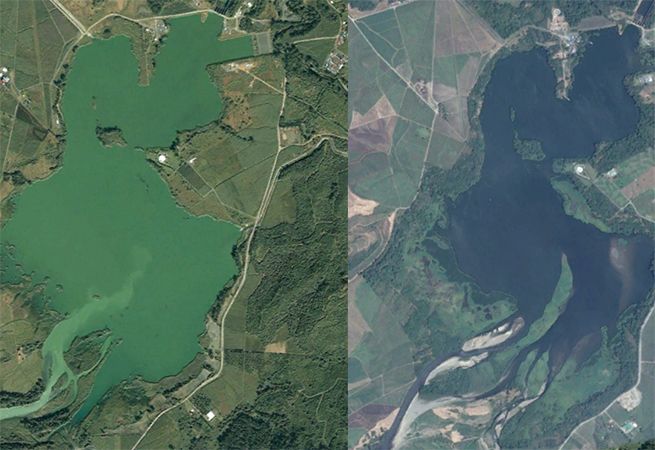
However, empty flushing is not effective for removing deposited sediment in the delta, as shown in figure 6. It is necessary to implement additional sediment management strategies, such as dredging, to recover some of the areas not affected by the flushing operations.
In addition, ICE has been implementing the Reventazón watershed management programme since 2000 to improve water quality, increase forest area and control erosion. Through reforestation and Payments for Ecosystem Services (PES), the forest cover has increased significantly, which means less volume lost than expected and more energy generation at Angostura.
Monitoring has been implemented from the beginning to determine the loss of volume, identify hotspots with high sediment concentration, measure concentration of suspended sediment discharge, establish the sedimentation rate, and propose corrective measures.
Bathymetric surveys are carried out using an echo sound system just ahead of and after each flushing event and during high precipitation events, when flow exceeds 1,500 m3/s. The spread of water hyacinth is preventing the boats carrying the echo sound systems from reaching some areas, and therefore making it difficult to determine the total volume of the reservoir.
By applying the sediment management strategies explained above, the records in the figure 5 show that active volume loss is less than expected. However, inter-annual oscillations are significant. In 2004, four years after the commissioning of the dam, the volume loss was about 7 per cent, instead of the expected 22 per cent. On the other hand, the difference between volume lost and expected volume lost in 2005 was just 3 per cent. After 12 years of operation, the active volume loss was 30.4 per cent instead the estimated volume loss of 31.7 per cent