Drawdown Flushing
54 Mm3
160 MW
1966
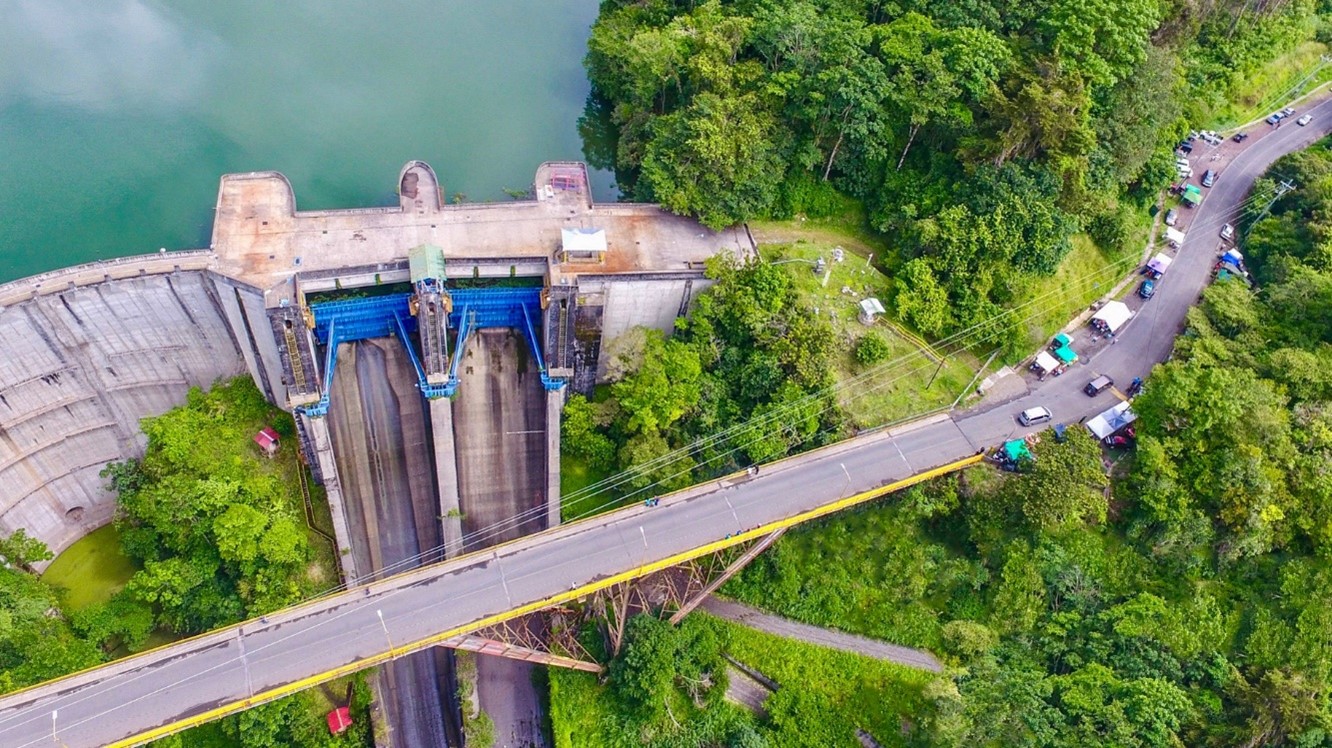
The Cachí arch type dam, unique in Costa Rica, is located in the Ujarrás Valley near the town of Cachí, a place of great historical and tourist value. Its 76 m high dam impounds 54 million m3 of reservoir storage covering an area of 324 hectares, with a maximum depth of 68.5 m and a length 6 km. Cachí is operated by ICE (Instituto Costarricense de Electricidad) and began its commercial operation in May 1966 for the sole purpose of hydropower production, reaching an installed capacity of 100 MW in 1978. Between 2014 and 2015 this was expanded to 160 MW, allowing it to take advantage of all the flow captured in its reservoir. The steep slopes and rainfall patterns within the catchment facilitate high erosion and sediment transport. Flushing operations carried out at the dam since 1973 have been successful in preserving the storage capacity of the reservoir by reducing the reservoir trap efficiency from 82 to 27 percent. [1]

The Reventazón River originates at the base of the Irazú volcano and stretches for a length of 125 km from Cachí dam before pouring into the Caribbean Sea. The reservoir created by the Cachí dam intercepts 919 km2 (~31 percent) of Reventazón River’s total catchment area. The catchment receives an average annual rainfall of 2781 mm, with maximum values exceeding 7500 mm. The soils upstream were formed from volcanic ashes, colluvial and residual materials.
Although 50 percent of the basin is covered by forest, there are areas subject to severe erosion, especially on the slopes of the Irazú Volcano. In addition, the area has steep slopes between 20 and 85 degrees and is subject to seismic activity - a significant number of landslides have been recorded upstream of the reservoir. Figure 5 illustrates this for a single rainstorm in 1987. The steep slopes and rainfall patterns within the catchment facilitate high erosion and sediment transport which yields an annual average sediment influx of 0.81 million tonnes into the reservoir. The Cachí reservoir consists of one narrow lower basin and one wider upper basin (see Figure 1). Much of the coarser material which enters the reservoir deposits in the upper basin, while much of the fine sediment is transported as density currents along the old river thalweg to the lower basin. Accordingly, grain size on the terraces declines moving downstream, from an average of 0.70 mm in the upper basin to less than 0.015 mm near the dam.
The highly dynamic humid tropical environment where the Cachí reservoir is situated, with high rates of siltation within the reservoir, make annual flushing necessary to preserve capacity.
Annual sediment accumulation in Cachí reservoir constitutes about 1 percent of its gross capacity. The reservoir was designed with a low level outlet which can be used for flushing. However, it was operated without flushing for the first seven years and trapped 82 percent of the incoming sediment. Challenges with hydropower production arose when sediments built up close to the dam (Figure 2) and started to be pulled into the deep power intake, hence the necessity to flush out sediments at least once a year.
Despite flushing, the upper part of the reservoir is being progressively filled with sand and gravels delivered by floods, which are generally not removed by the lower-flow flushing events. The coarse material accumulates at the entrance of the upper reservoir in the form of a delta which is gradually advancing toward the dam, burying both the floodplain deposits and the flushing channel. Between 1966 and 1990, the upper part of Cachí reservoir accumulated 4 to 6 million m3 (8 to 12 m in thickness) of coarse material despite annual flushing.
The lower basin consists of a deep river channel maintained by flushing, between a series of relatively flat river terraces onto which fine sediment is deposited. Sediment deposited on the terraces is typically not removed by flushing, resulting in an average annual accumulation rate of about 5 cm.

The dam was constructed with a single bottom outlet located near the thalweg of the original river channel and immediately adjacent to the intake screen, a location which facilitates flushing of sediment from in front of the intake. Flushing operations have been considered successful in preserving the storage capacity of the reservoir, largely due to the shape of the reservoir with a rather narrow gorge, with a significant proportion of the sediment accumulating in the gorge section rather than on submerged terraces. Density currents are an important sediment transport and deposition process.
The first flushing operation was carried out in October 1973 to flush sediments that had accumulated near the power intake after seven years of dam operation. Owing to the success of this operation, it was decided to carry out flushing at least once every year during the wet season to allow rapid refilling and also to coincide with a long holiday weekend when electrical demand is low.
The reservoir is typically flushed in three stages:
(i) Slow Emptying: 25 days of slow drawdown from the reservoir, lowering the water table from 990 m (full impounding level) to 965 m at a rate of 1 m / day while the turbines operate at full capacity.
(ii) Final Flushing: a rapid draw down or main flushing phase of approximately 5-10 hours, when the remaining impounded water is released. By the end of the main flushing phase, the flow resembles a mudflow.
(iii) Free Flow: Water flows freely through the empty reservoir for 2 to 4 days, and on some occasions up to 15 days. During this stage, the river carries scours a considerable volume of sediment from gorge, but no sediment is removed from the now-dry terraces. This emptying period is also utilized to carry out dam inspection and maintenance.
After the flushing period the reservoir is refilled over a period of 16 to 21 days, depending on water availability and electricity generation needs.

The total amount of flushed-out sediments usually varies between 500,000 tons to 1,000,000 tons, with the greatest rate of release occurring during the end of the rapid evacuation phase and start of the free flow phase. The amount of sediment released during each stage varies considerably from one event to another, reflecting variations in the rates of sediment inflow, flushing flow rates and duration, and different intervals between flushing events. Figure 6 illustrates the variation in amounts flushed during 1983-2003. The released sediments are deposited along the entire river downstream of the dam to the Caribbean Sea. However, sediment discharge to the sea has since been impeded by the construction of two new dams downstream, Angostura in year 2000 and Reventezón in 2016.

During each flushing operation, in which peak concentrations exceeding 400 g/l have been measured, it was observed that substantial amounts of sediment were deposited on lower floodplain areas between the dam and the Caribbean and a stratified plume of turbid water was observed in the sea. It was expected that the riverine deposits would be eroded by subsequent floods. No studies appear to have been carried out on the effect of the sediment on downstream biology, although anecdotal reports from local observers suggest that the concentrated sediment releases cause extreme mortality to all types of river biota in the reach immediately below the dam.
Even though the process of reservoir drawdown is gradual, the neighboring populations are informed about changes in the normal flow of the river downstream prior to flushing. Since the completion of the Angostura dam in 2000 located downstream of Cachí dam, reservoir emptying has been synchronised at the two dams to facilitate sediment transport along the river.
It was estimated that without flushing, half of the reservoir’s storage would be lost to sedimentation within 20 years. Flushing has maintained the power intake free of sediments and allowed a large part of the accumulated sediments to be discharged, thereby maintaining 80 percent of original volume after 38 years of operation [7]. It also allows turbid density currents to continue to transport fine sediment along the scour channel maintained by flushing, passing these fines through the turbines during normal power generation operations, thereby contributing to a favorable sediment balance across the reservoir and also reducing the load of fines to be discharged during flushing events. Monitoring of the reservoir’s sediment balance showed that approximately 18% of the inflowing sediment was released downstream in this manner, and another 54% of the sediment inflow is focused within the scour channel where it can subsequently be released by flushing.[5]
This site demonstrates how the application of a regular flushing strategy can preserve the long-term capacity of a hydropower reservoir. It shows that the scour channel maintained by annual flushing can allow fines transported by turbidity currents to be passed through the turbines, while also acting as a feature that focuses the trapping of sediments into a zone where they can be subsequently released during empty flushing periods.
Brandt, S. A. (2005). Conceptualization of hydraulic and sedimentary processes in downstream reaches during flushing of reservoirs. In XXXI IAHR CONGRESS. 11-16 september, 2005, COEX, Seoul, Korea. (pp. 2577-2588). Korea Water Resources Association.
Jansson, Margareta & Rodríguez, Alexis. (1992). Sedimentological studies in the Cachi Reservoir, Costa Rica: sediment inflow, reservoir sedimentation, and effects of flushing. 81. https://www.researchgate.net/publication/297117608_Sedimentological_studies_in_the_Cachi_Reservoir_Costa_Rica_sediment_inflow_reservoir_sedimentation_and_effects_of_flushing
Jiménez, O., Farias, H. and Rodríguez, C. (2005) ‘Procesos de sedimentación en embalses en ambientes tropicales. Estudios de casos en Costa Rica y República Dominicana’, Ingeniería del agua, 12. doi: 10.4995/ia.2005.2561.
Morris, G.L., Fan, J., 1997. Reservoir Sedimentation Handbook: Design and Management of Dams, Reservoirs, and Watersheds for Sustainable Use. McGraw-Hill, New York, xxiv+805 p.